North Richland Hills Climate Data
Note: Grid data is from 10.8 km away, so local conditions may vary.
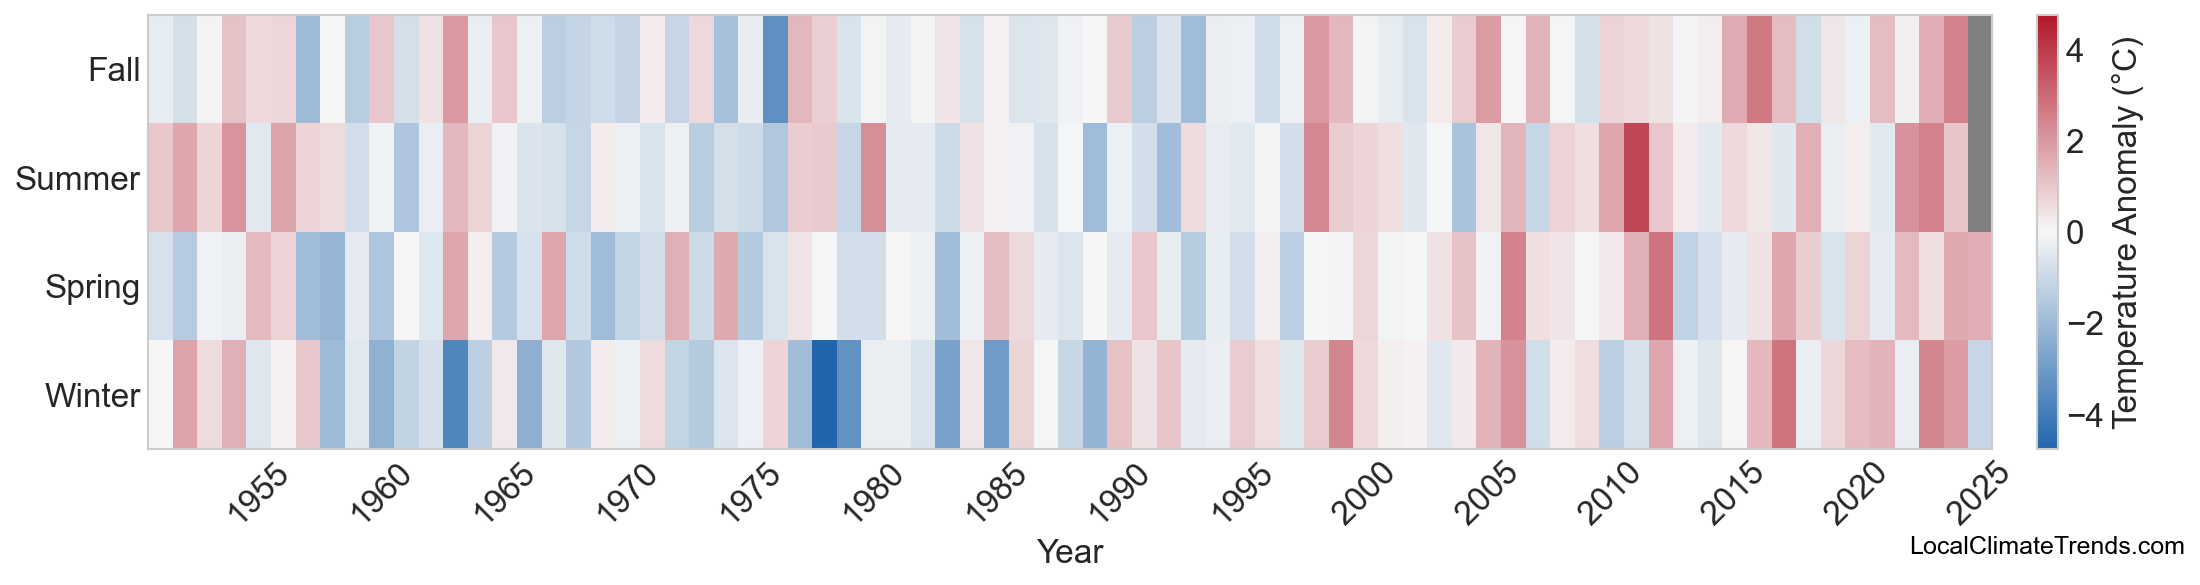
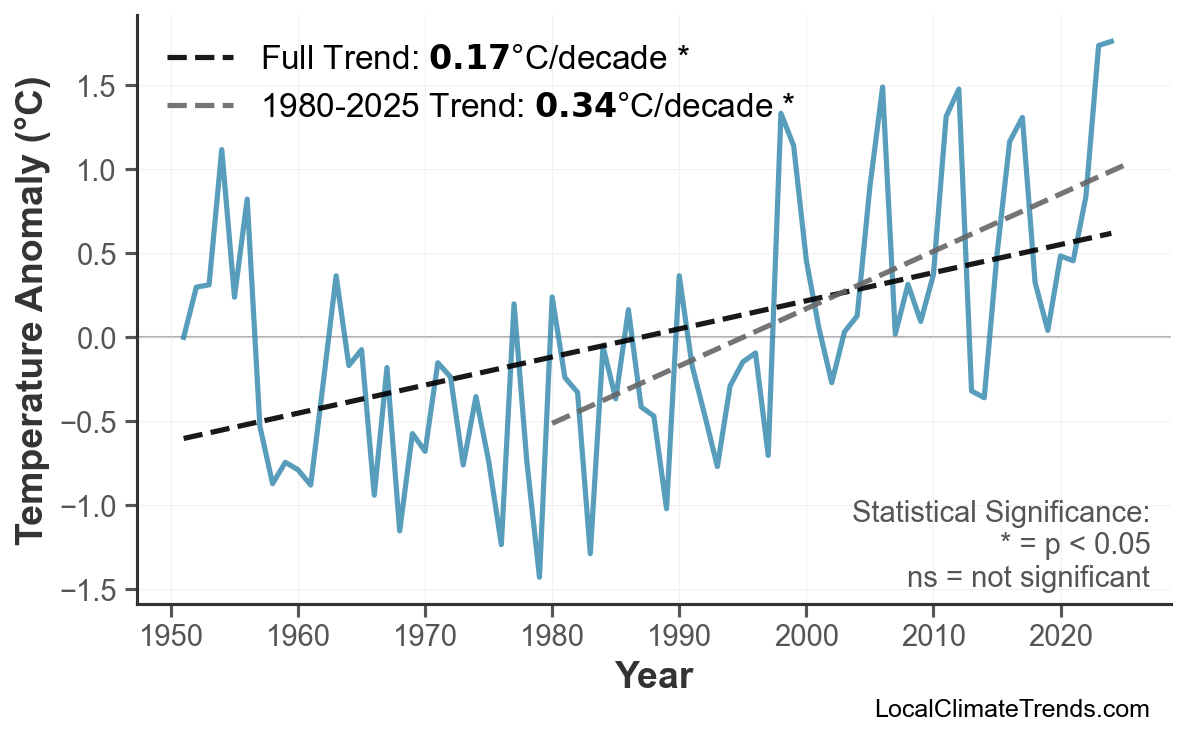
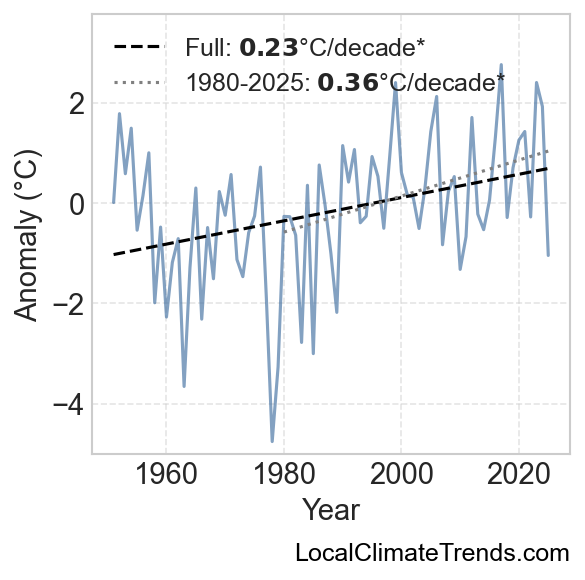
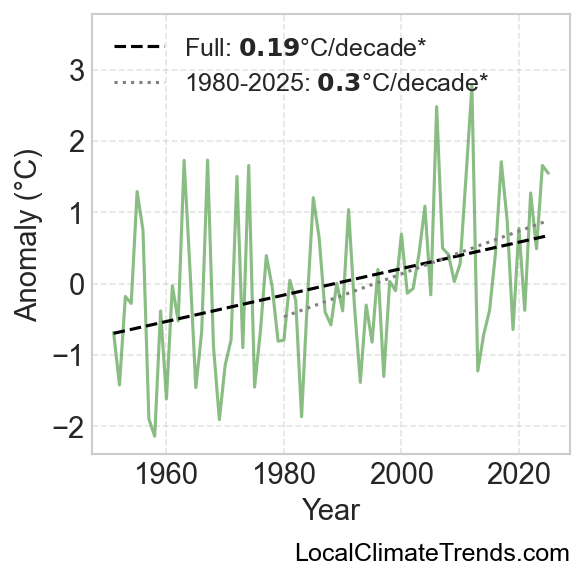
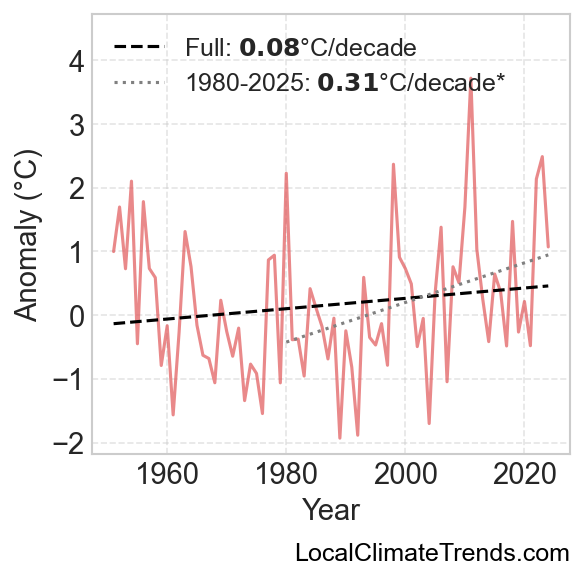
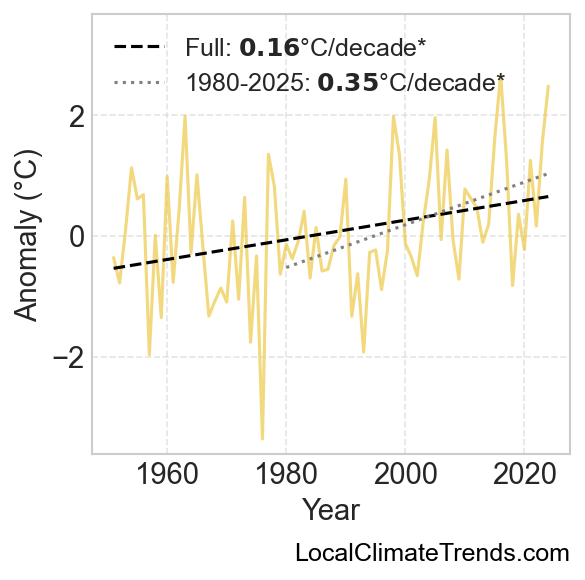
Since 1951, North Richland Hills's average temperature has risen by about 0.0°C, with the most striking increases hitting all seasons. The pace quickened after 1980, averaging 0.0°C of warming per decade.