Mount Carmel Climate Data
Note: Grid data is from 12.5 km away, so local conditions may vary.
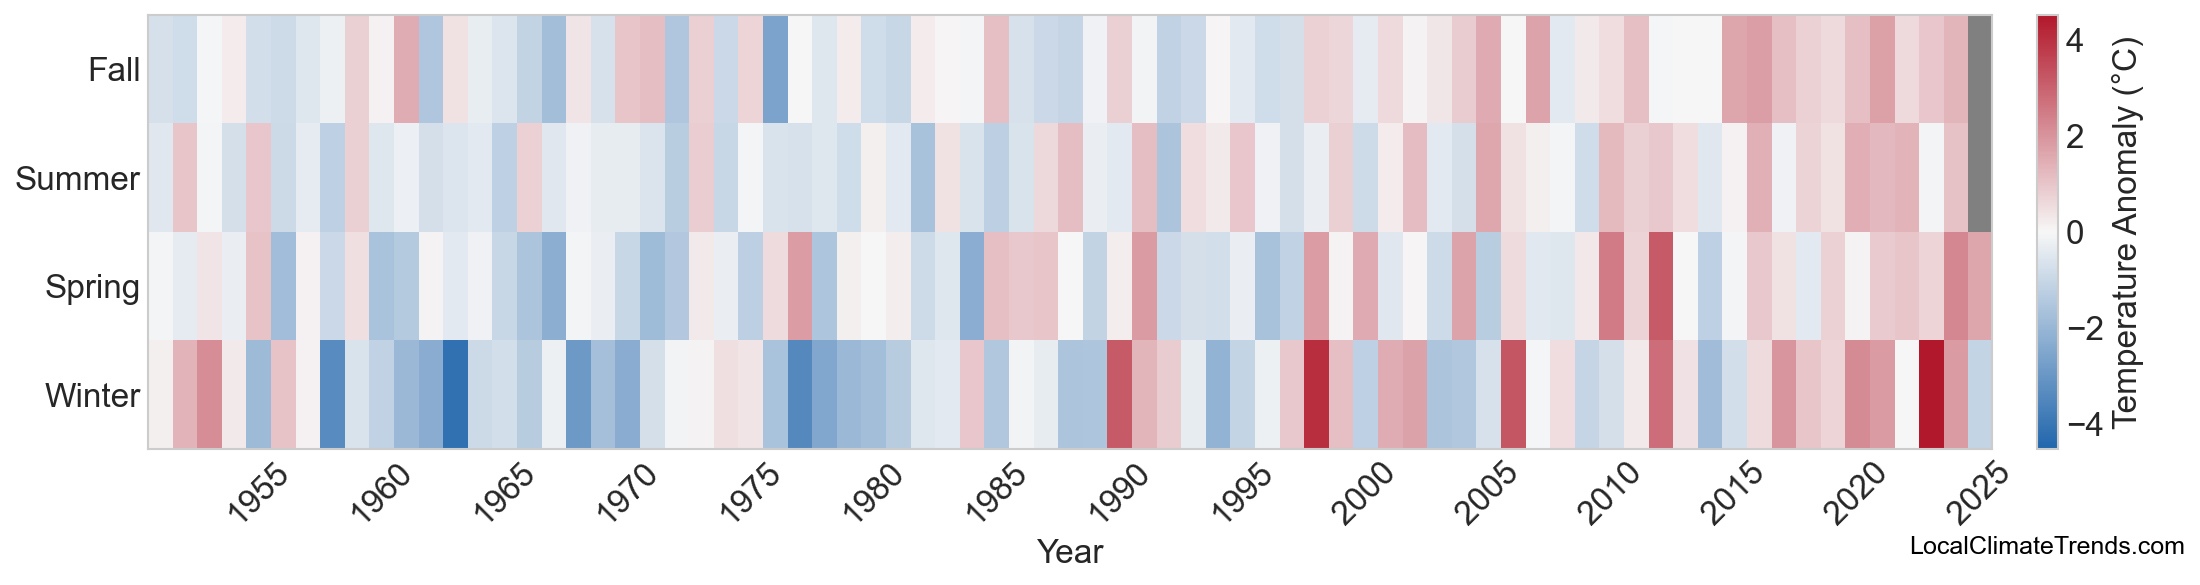
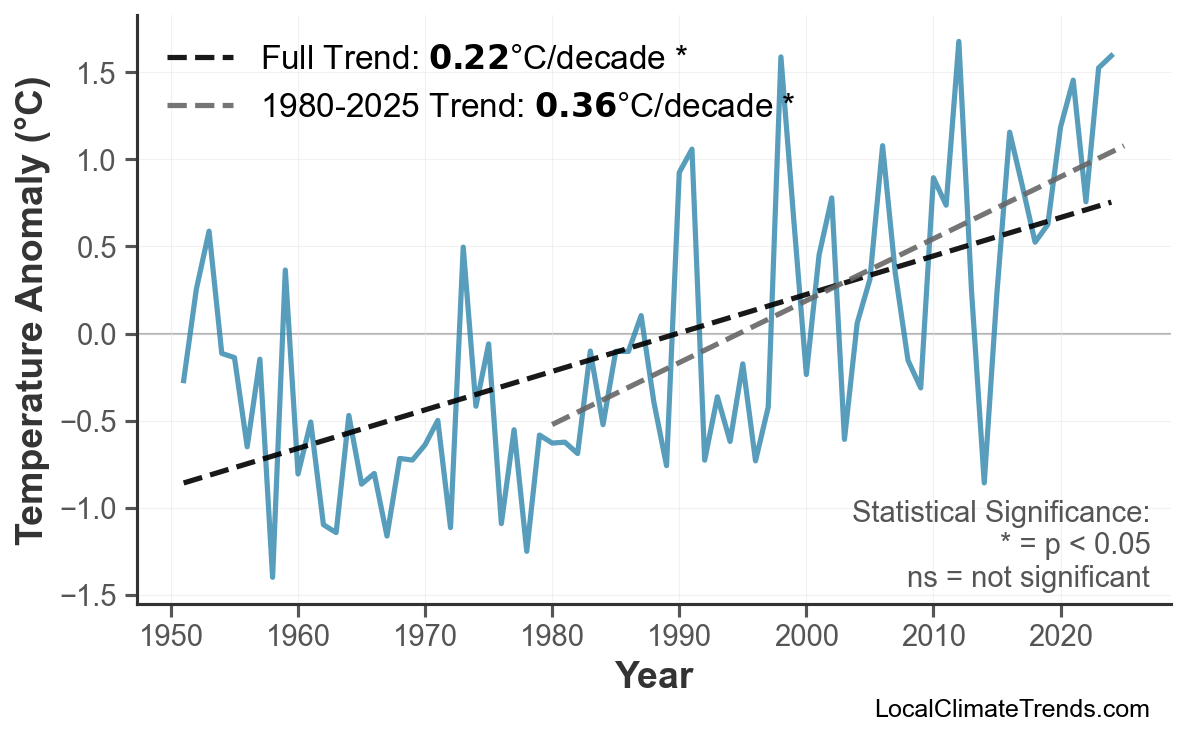
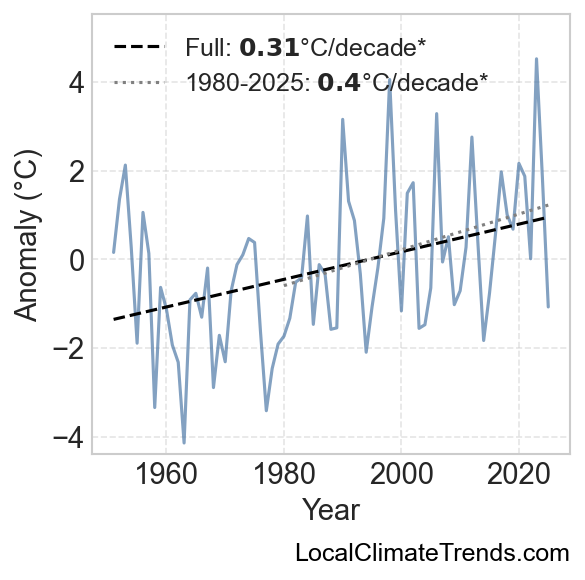
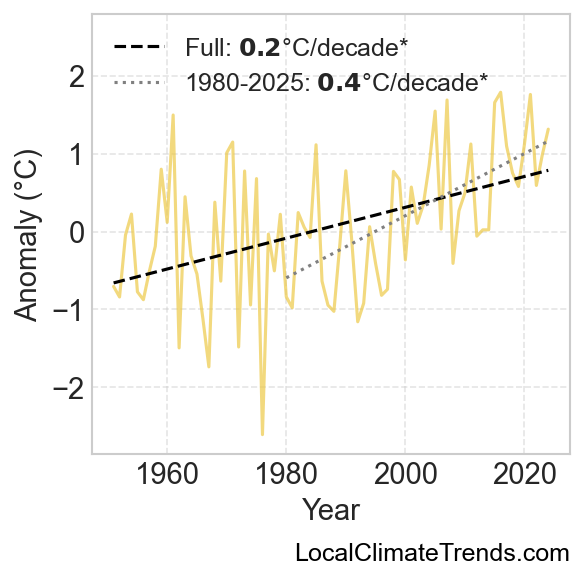
From 1951 to the present, average temperatures in Mount Carmel have increased by about 0.0°C, especially during all seasons. Since 1980, the warming rate has hovered near 0.0°C per decade.