Harleysville Climate Data
Note: Grid data is from 10.1 km away, so local conditions may vary.
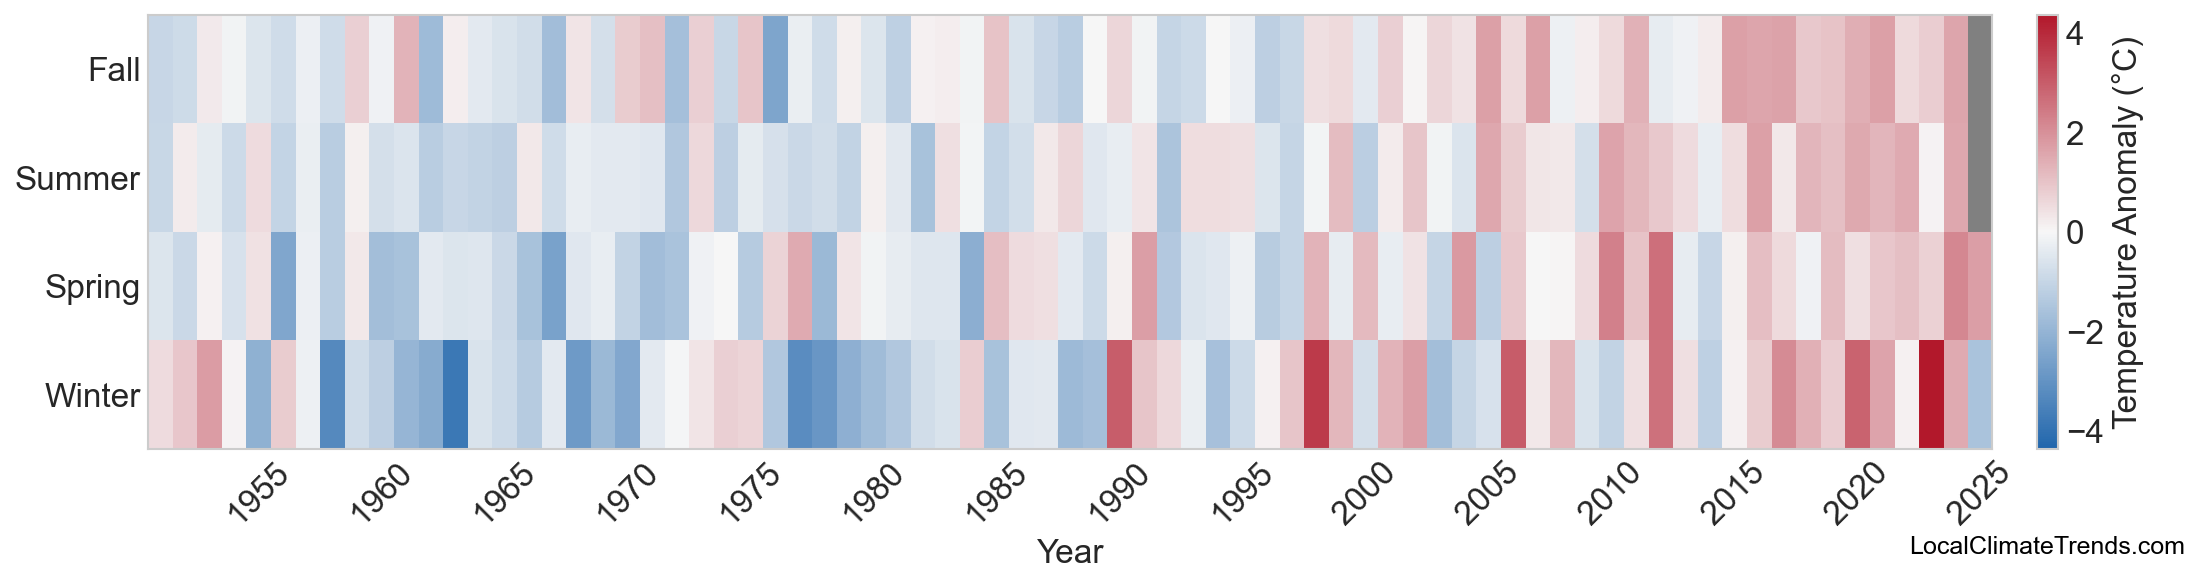
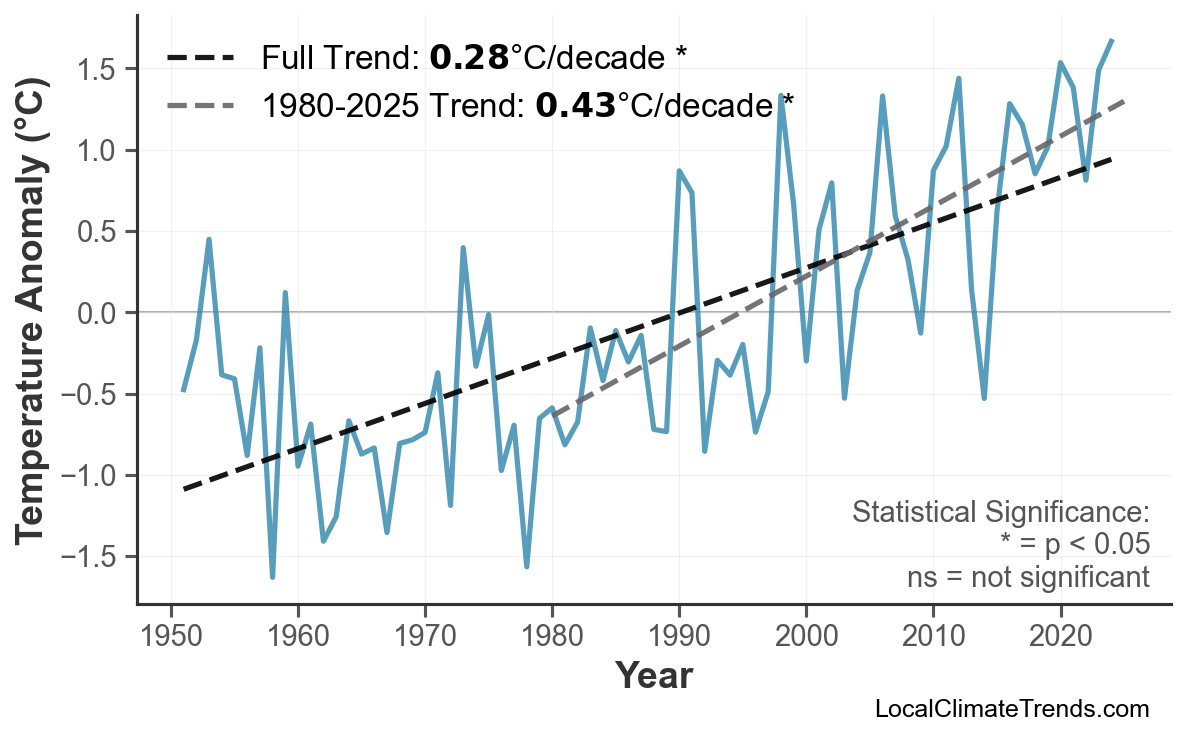
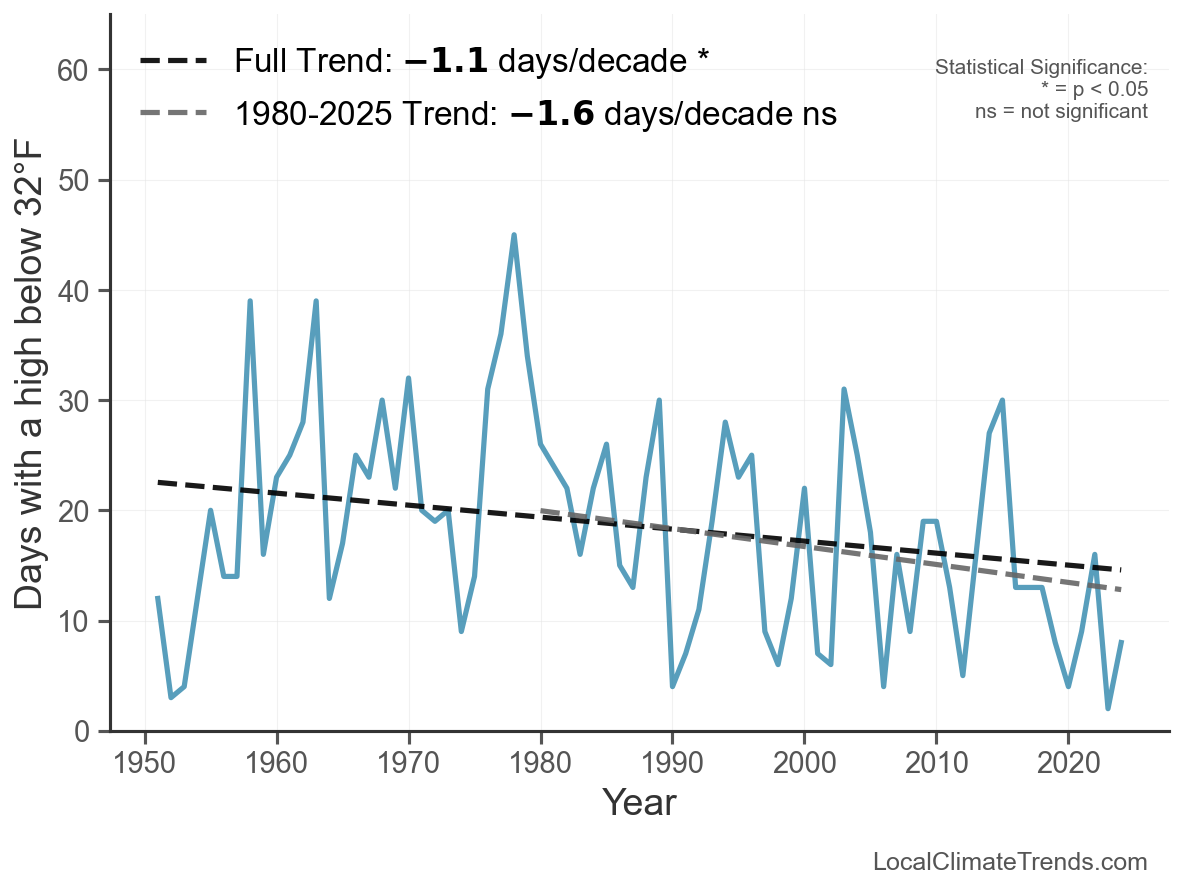
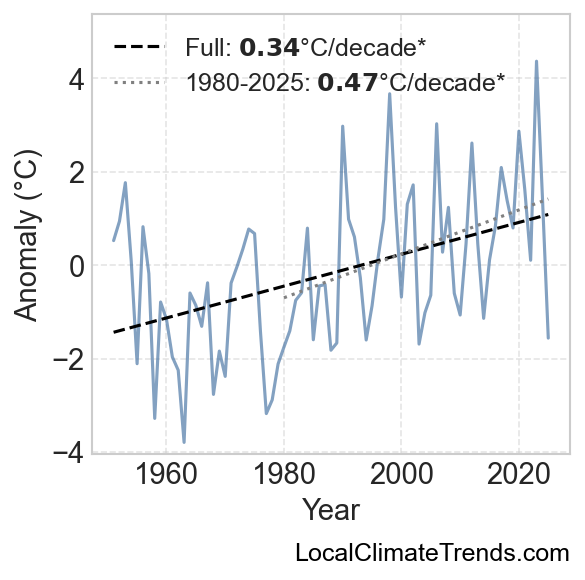
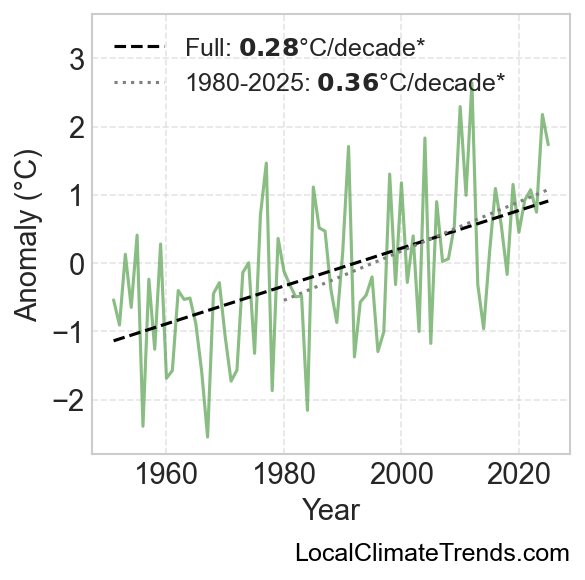
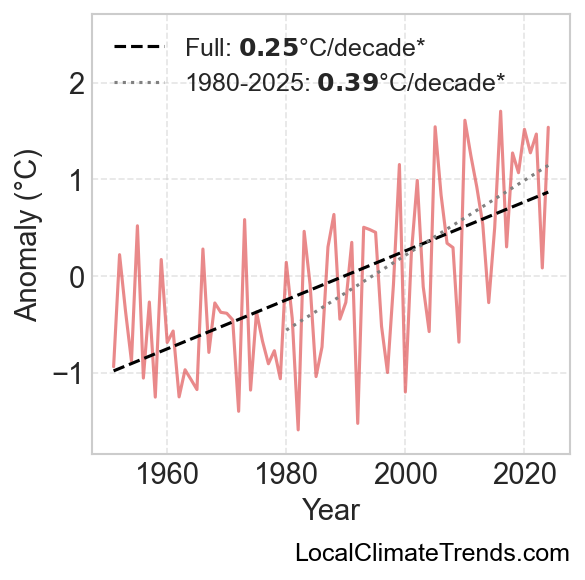
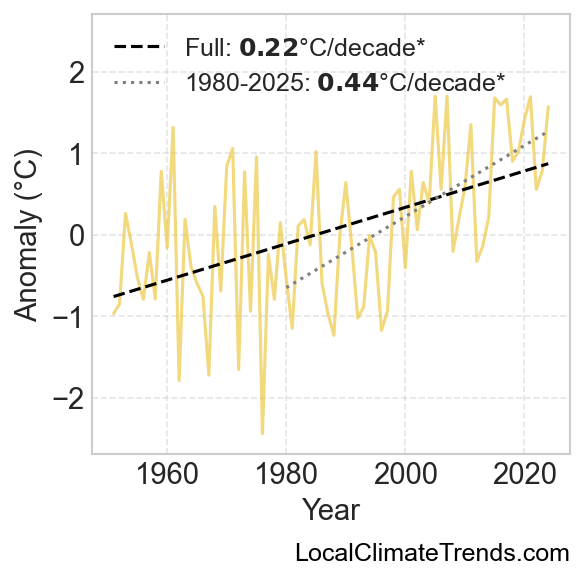
Since the early 1950s, Harleysville's climate has shifted by 0.0°C, driven largely by warmer all seasons. The trend accelerated after 1980, reaching 0.0°C per decade.