Doylestown Climate Data
Note: Grid data is from 14.9 km away, so local conditions may vary.
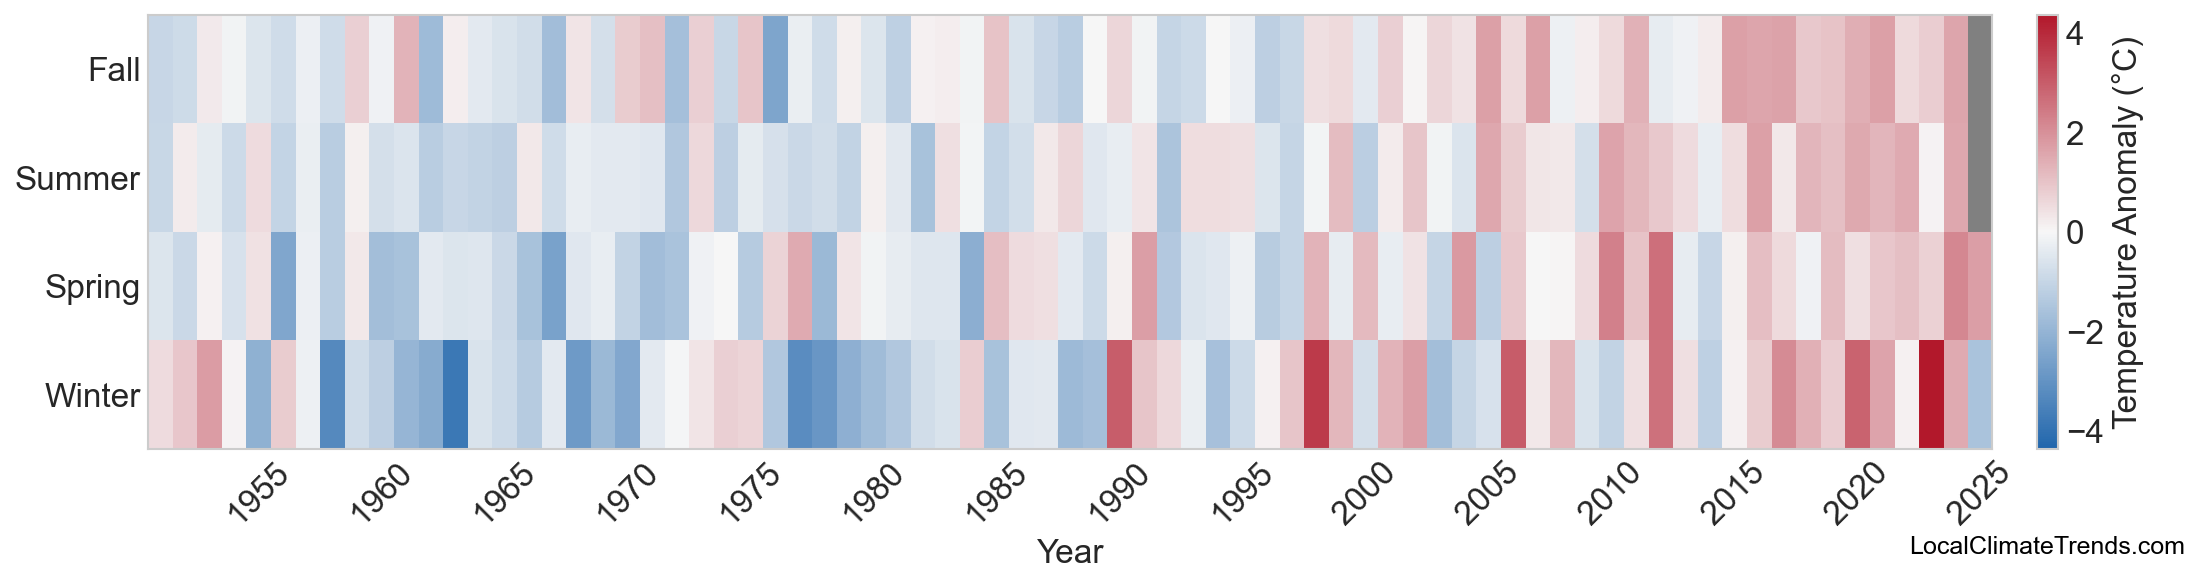
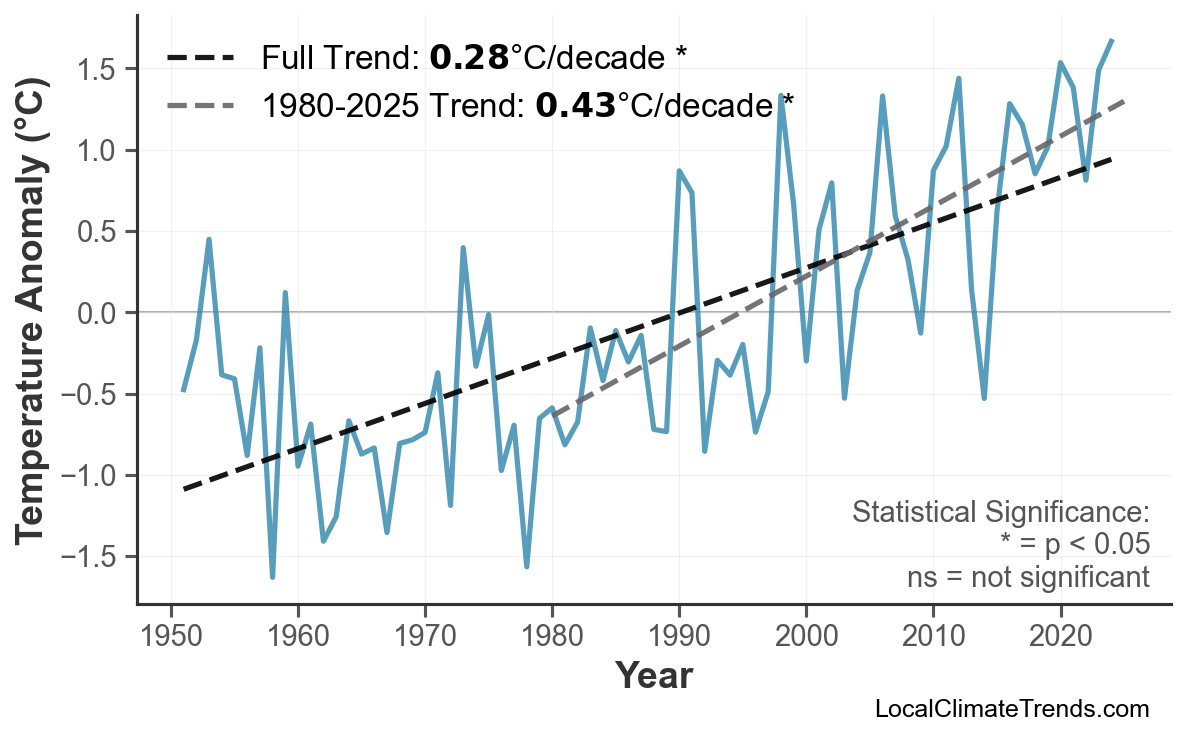
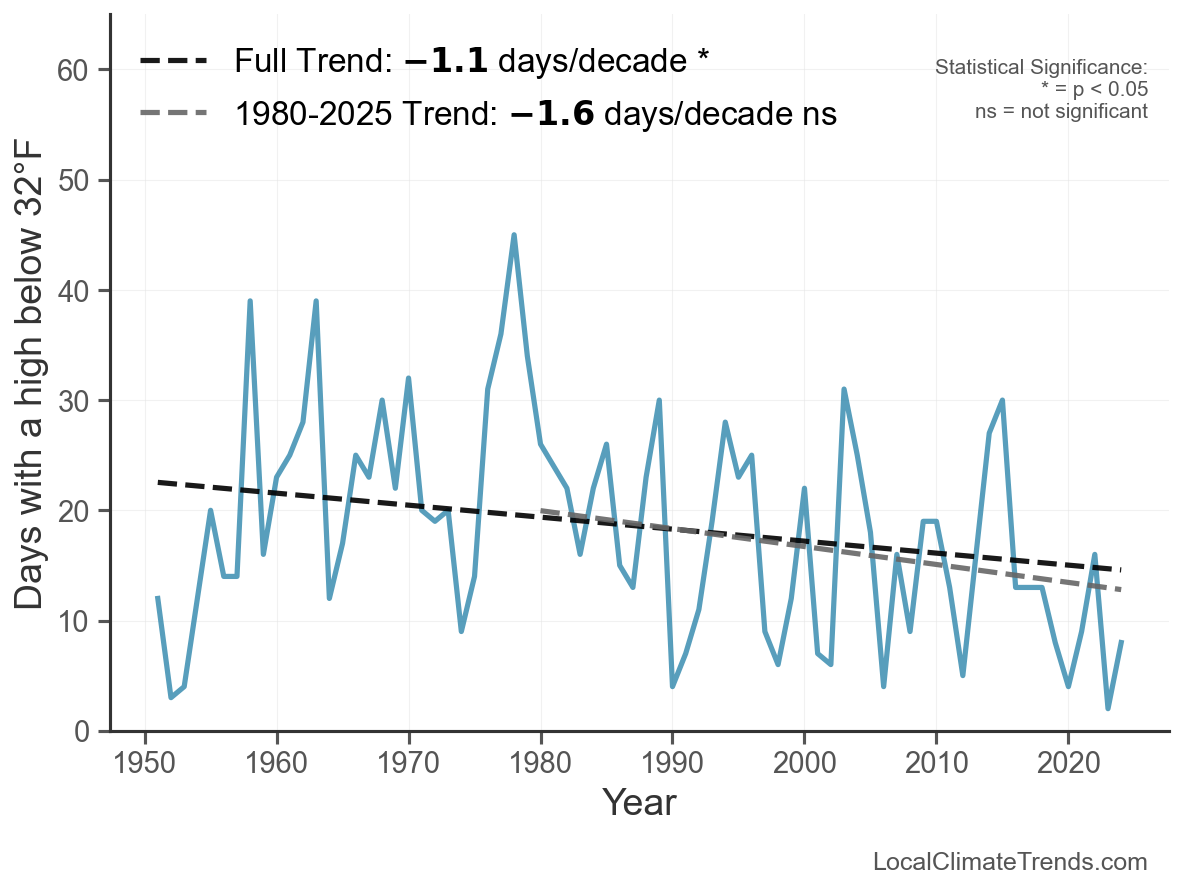
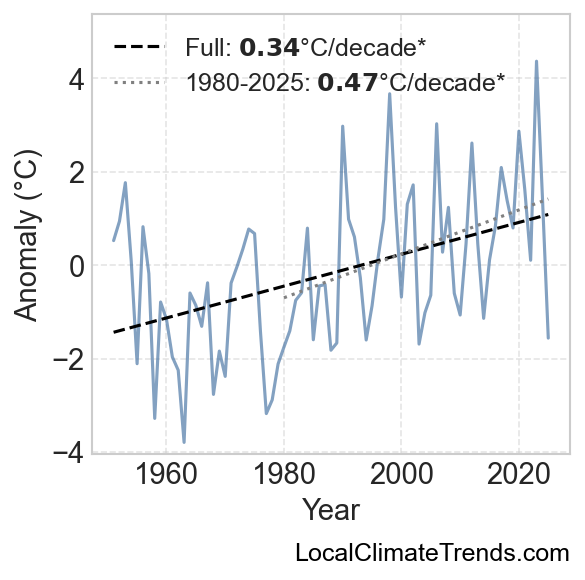
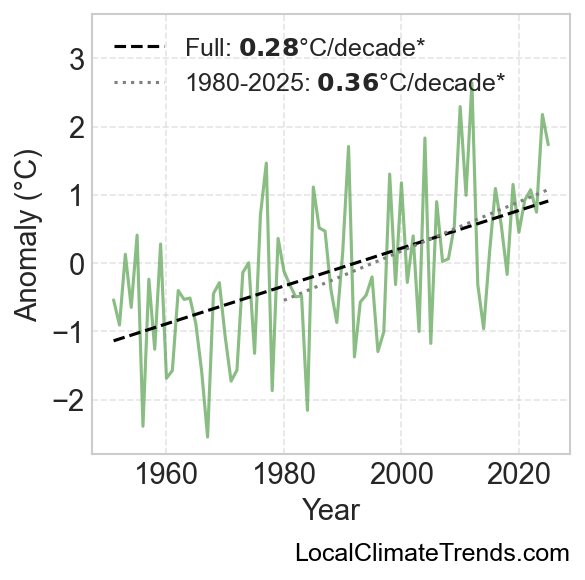
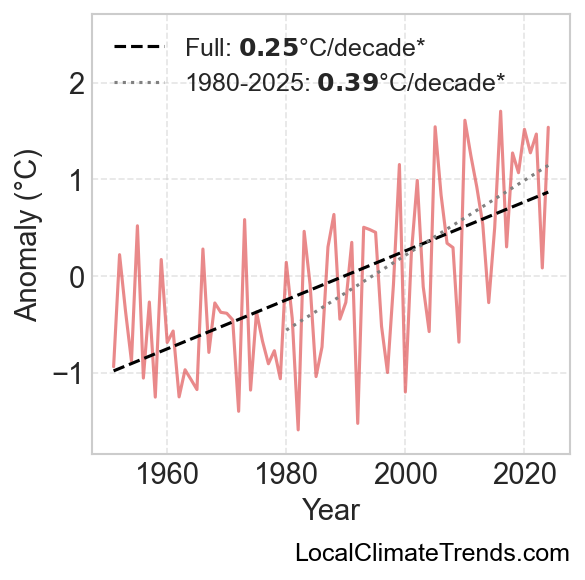
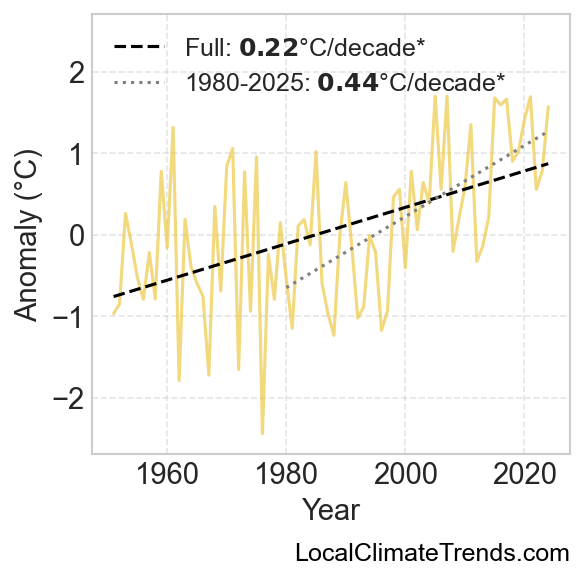
Records dating back to 1951 reveal a 0.0°C rise in Doylestown's mean temperature, most evident in the all seasons seasons. The post‑1980 period alone has added 0.0°C of heat per decade.