Manhattan Beach Climate Data
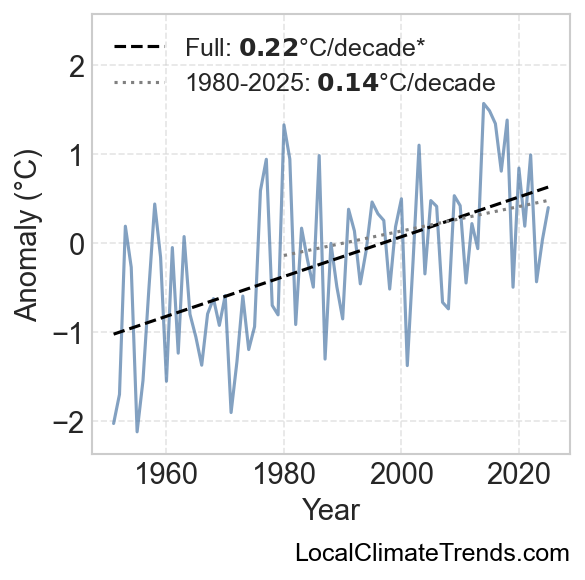
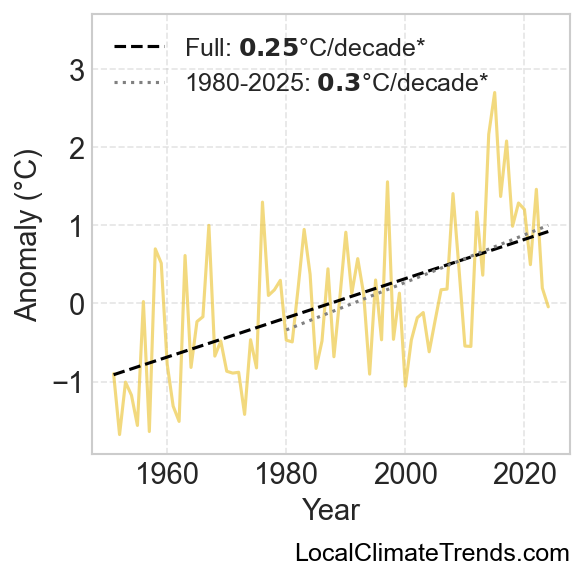
Since the early 1950s, Manhattan Beach's climate has shifted by 0.0°C, driven largely by warmer all seasons. The trend accelerated after 1980, reaching 0.0°C per decade.

Since the early 1950s, Manhattan Beach's climate has shifted by 0.0°C, driven largely by warmer all seasons. The trend accelerated after 1980, reaching 0.0°C per decade.
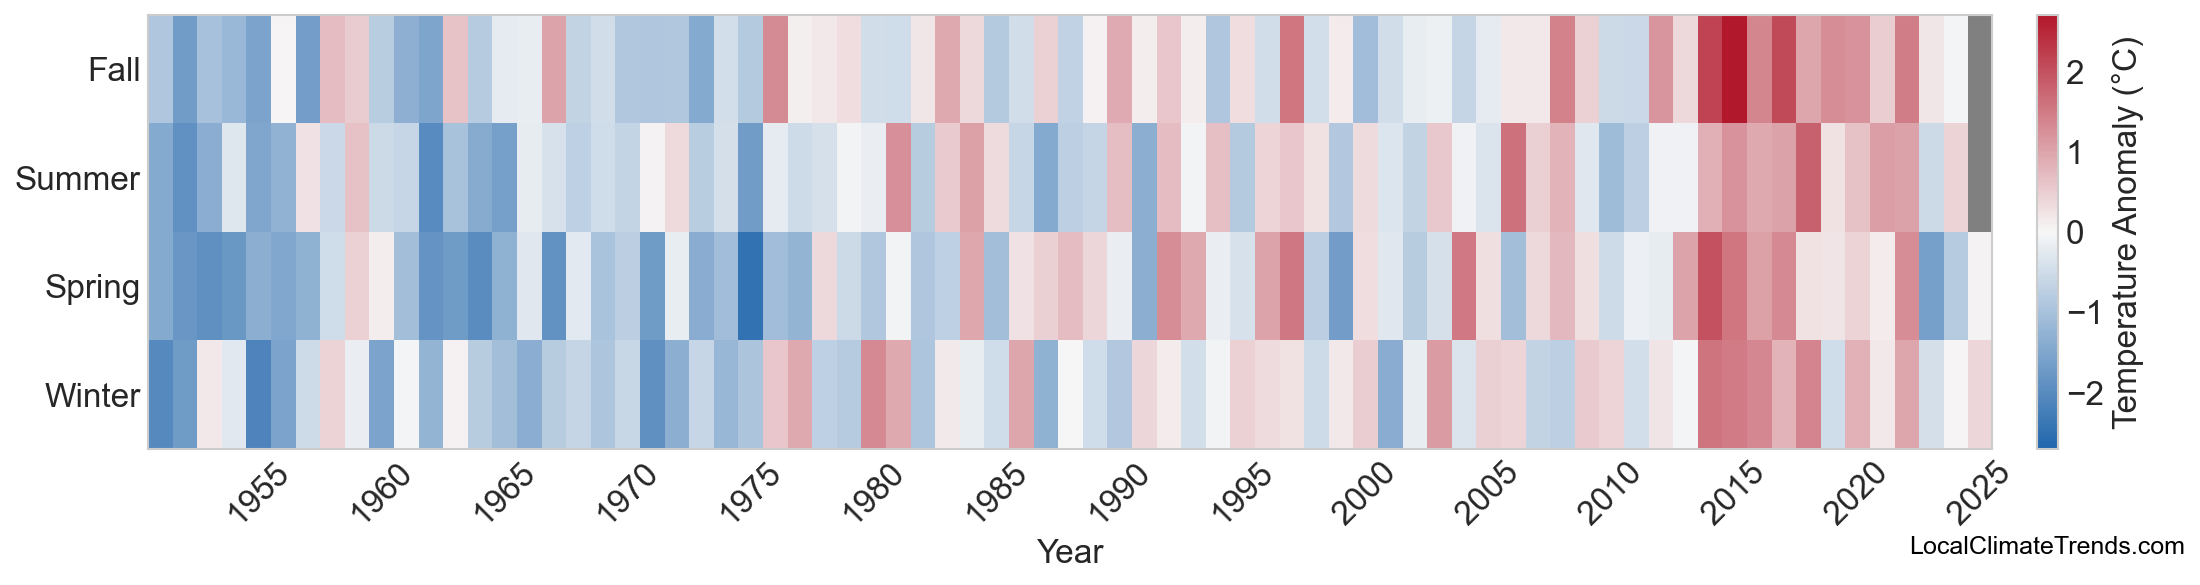
This heatmap shows seasonal temperature anomalies relative to the 20th-century average for each year from 1950 to 2024. Each row represents a season (Winter, Spring, Summer, Fall), and each column a year. Red shades indicate warmer-than-average seasons, while blue shades represent cooler-than-average ones. The shift from predominantly blue to red over time highlights the long-term warming trend across all seasons.
⬇️ Download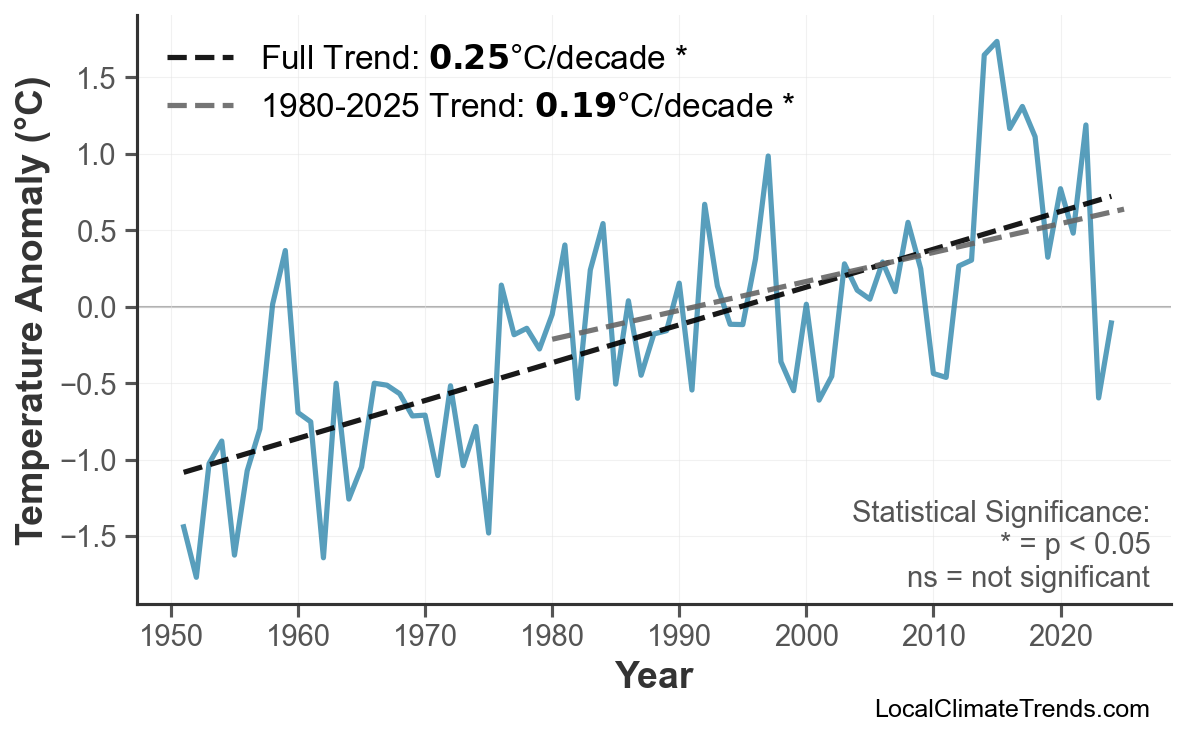
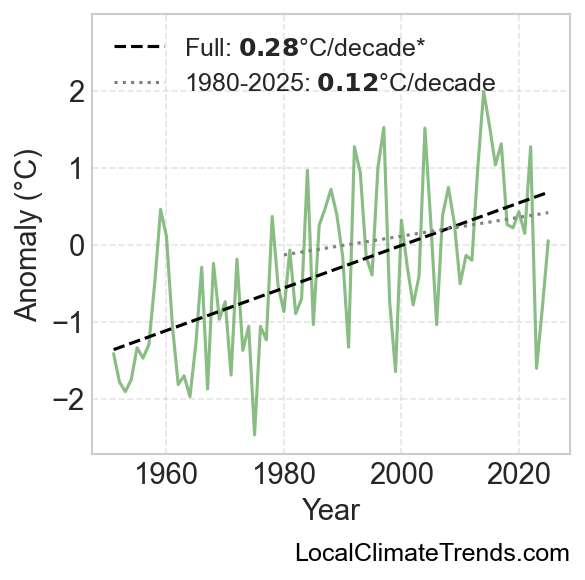
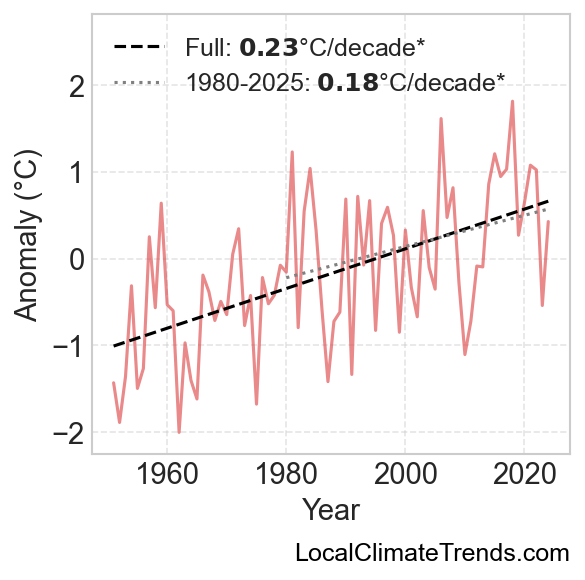
Temperature data shows warming trends for Manhattan Beach based on NOAA NClimGrid climate data.
⬇️ Download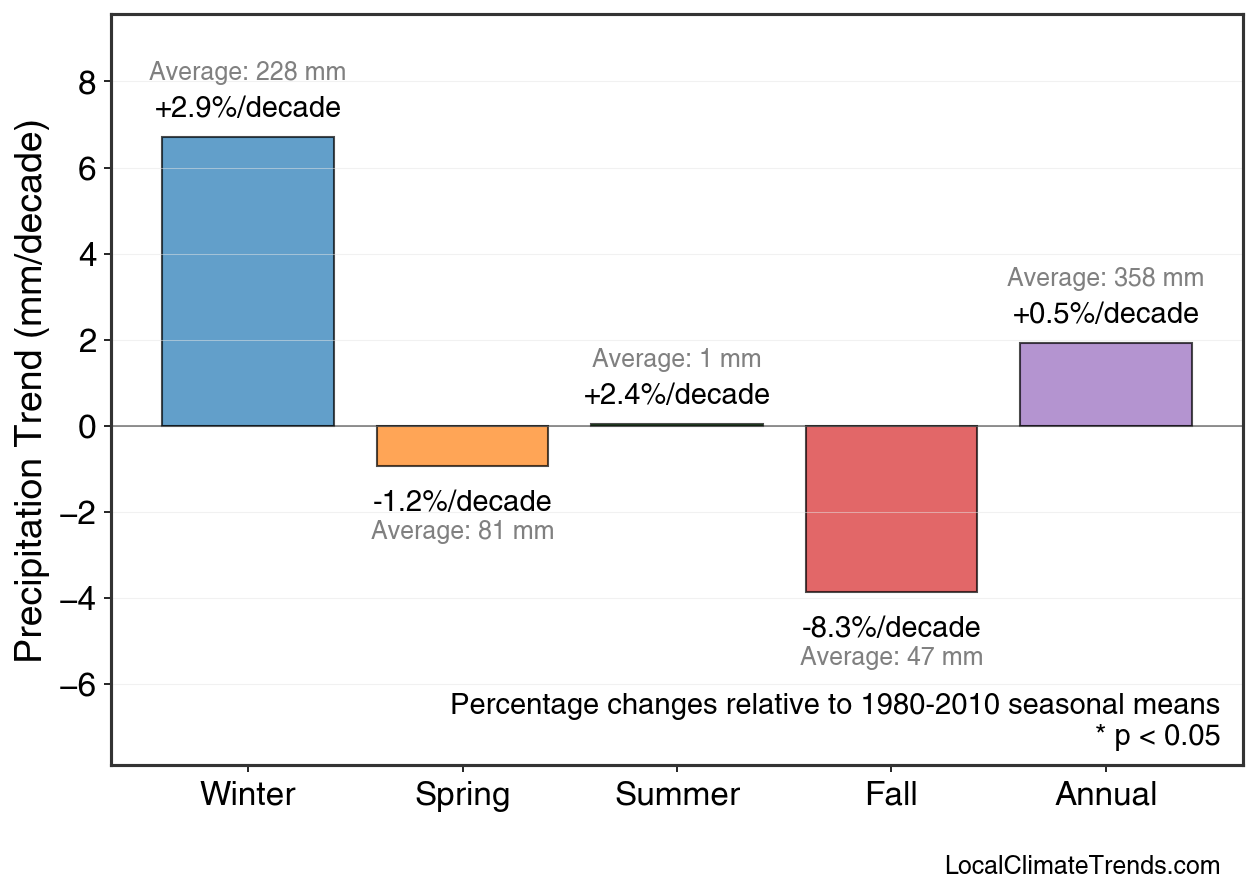
This chart shows seasonal precipitation trends for Manhattan Beach area, displaying how rainfall patterns have changed over time across different seasons.
⬇️ DownloadManhattan Beach has warmed by 0.0°C on average since 1951. This warming trend is consistent with broader climate change patterns observed across the region.
Winter has experienced the most warming with 0.0°C of temperature increase since 1951. This seasonal variation is typical of mid-latitude climate change patterns.
Precipitation patterns in Manhattan Beach have remained relatively stable since 1951, though year-to-year variability continues to be significant.
Yes, the warming observed in Manhattan Beach is consistent with regional and global climate change trends. The temperature increases align with patterns seen across CA and the broader United States, reflecting the impacts of human-caused climate change.
The climate data for Manhattan Beach comes from NOAA's NClimGrid dataset, which provides gridded climate information based on weather station observations. The data represents the 4.32km grid cell nearest to Manhattan Beach, located at coordinates 33.85°N, 118.39°W.
The historical climate trends shown for Manhattan Beach are based on observed data from 1951 to present and are highly reliable. These trends provide insight into how the local climate has already changed and can inform expectations for continued warming, though specific future projections would require additional climate modeling.